Geopolitics grabs market spotlight
- Stocks stumble on Israeli strike, slip for the week
- Oil hits five-month high, gold challenges records
- This week: Fed rate decision, retail sales, Juneteenth
What had been a relatively uneventful week for markets ended on a volatile note as Israeli military strikes on Iran drove stocks lower and sent oil prices to a five-month high.
However, as of Friday’s close, the damage was relatively contained. While S&P 500 futures tumbled as much as 1.9% on Thursday night in the wake of the attacks, the S&P 500 (SPX) index closed down 1.1% on Friday, ending the week with a modest loss:
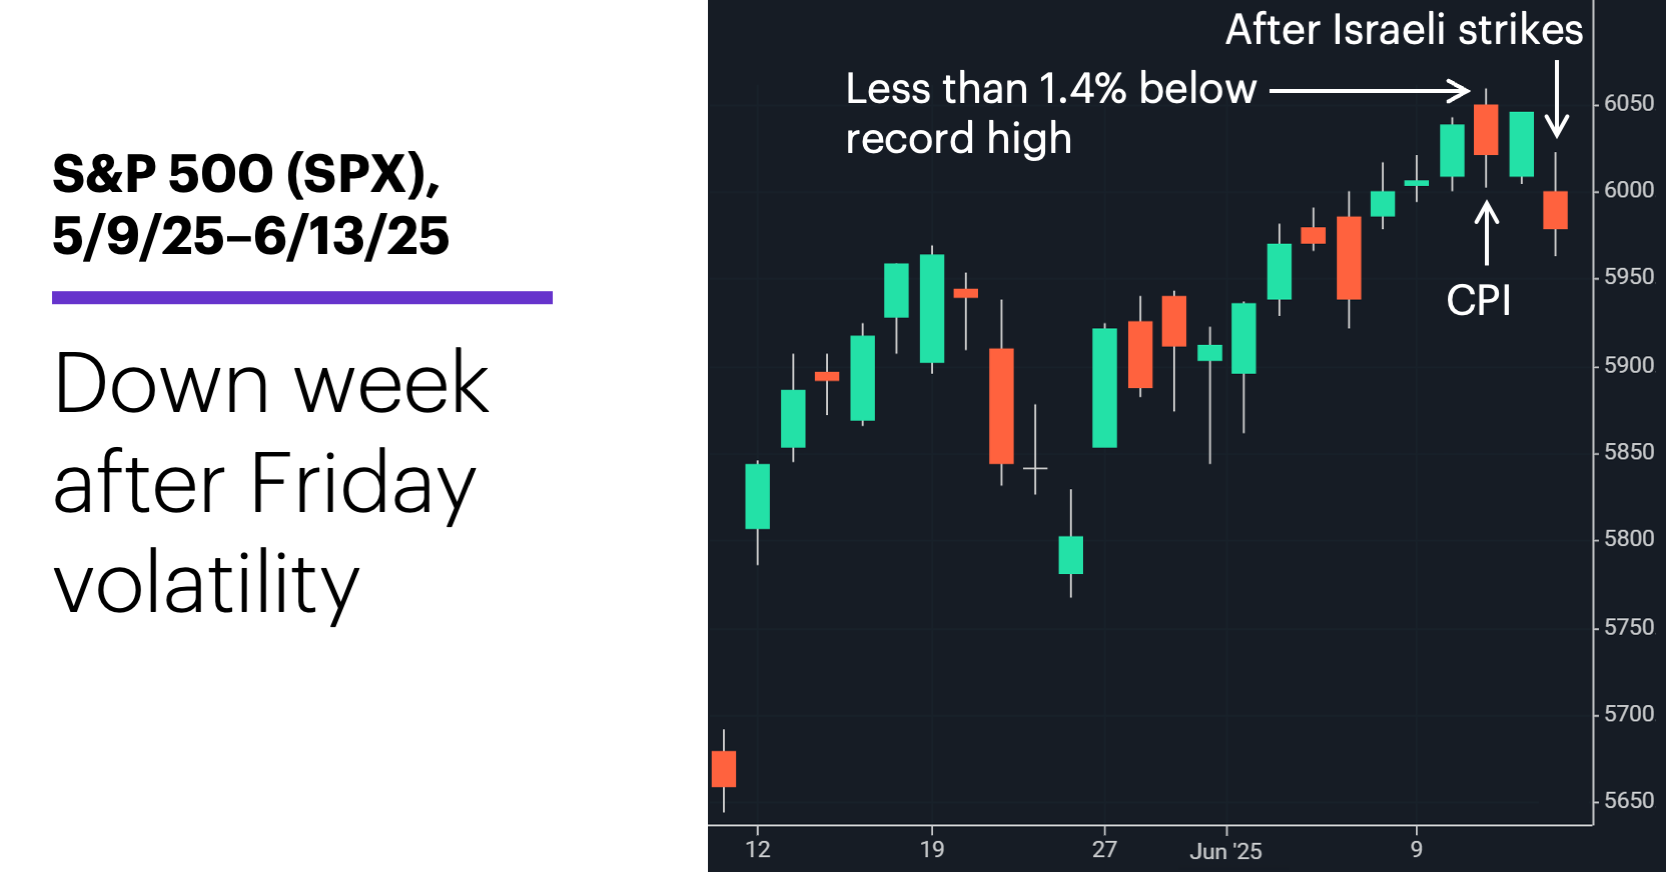
Source: Power E*TRADE. (For illustrative purposes. Not a recommendation. Note: It is not possible to invest in an index.)
The headline: Geopolitics overshadows economy.
The fine print: Earlier in the week, both the Consumer Price Index (CPI) and Producer Price Index (PPI) showed inflation increased less than expected last month, and the SPX climbed to within 1.4% of its all-time high. Also, Friday’s preliminary consumer sentiment report showed a sharp drop in inflation expectations. However, a sustained increase in oil prices could put upward pressure on inflation.
The move: Spot crude oil prices jumped more than 8.1% to $73.59 on Friday in the wake of the strikes, the market’s biggest one-day percentage gain since March 2022. Energy was the only positive S&P 500 sector on Friday.
The scorecard: The Russell 2000 (RUT) small-cap index slipped the most last week:
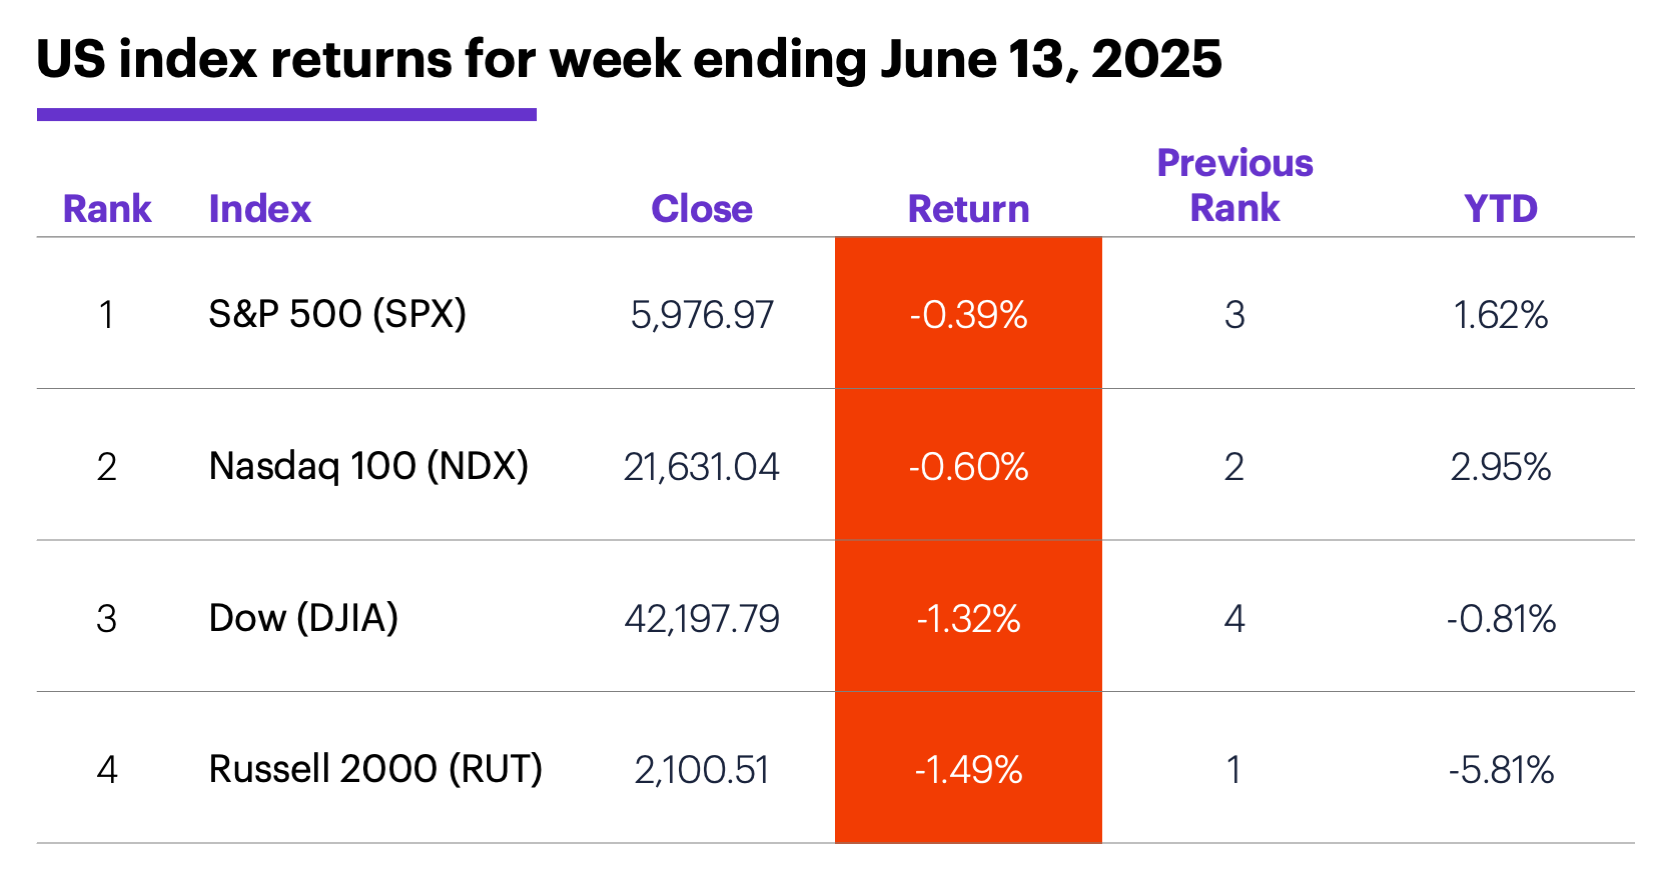
Source (data): Power E*TRADE. (For illustrative purposes. Not a recommendation.)
Sector returns: The strongest S&P 500 sectors last week were energy (+5.5%), health care (+1.2%), and utilities (+0.2%). The weakest sectors were financials (-2.8%), industrials (-1.8%), and consumer staples (-1.3%).
Stock moves: Newegg Commerce (NEGG) +32% to $13.69 on Monday, Insmed (INSM) +29% to $90.93 on Tuesday. On the downside, Lyra Therapeutics (LYRA) -24% to $18.42 on Monday, Simulations Plus (SLP) -24% to $20.05 on Thursday.
Yields: The benchmark 10-year Treasury yield fell 0.09% to 4.42% last week.
US dollar: Last Thursday the US Dollar Index (DXY) dropped to its lowest level since February 2022 and, despite a bounce on Friday, ended the week down 1.05 at 98.14.
Futures: July WTI crude oil (CLN5) closed Friday at $72.98, up $8.40 for the week. August gold (GCQ5) climbed $106.20 to $3,452.80, less than $20 below last month’s record close. Biggest up moves: July WTI crude oil (CLN5) +14.1%, August Brent crude oil (BQ5) +12.7%. Biggest down moves: September cocoa (CCU5) -5.2%, July natural gas (NGN5) -4.7%.
Coming this week
The Fed’s interest rate announcement and retail sales are the highest-profile events on this week’s calendar:
●Monday: Empire State Manufacturing Index
●Tuesday: retail sales, import price index, industrial production, capacity utilization, business inventories, NAHB Housing Market Index
●Wednesday: housing starts and building permits, Fed interest rate decision
●Thursday: US markets closed in observance of Juneteenth
●Friday: Philadelphia Fed Manufacturing Index, Leading Economic Indicators Index
This week’s earnings include:
●Monday: Ennis (EBF), KB Home (KBH), Lennar (LEN), Quantum Corp (QMCO)
●Tuesday: Jabil (JBL), John Wiley & Sons (WLY), La-Z-Boy (LZB)
●Wednesday: GMS (GMS), Kroger (KR)
●Friday: Accenture (ACN), Darden Restaurants (DRI), CarMax (KMX)
Check the Active Trader Commentary each morning for an updated list of earnings announcements, IPOs, economic reports, and other market events.
After the records
While there’s no way to know when the SPX will trade above its February 19 record high of 6,144.15, market watchers who have been eagerly anticipating the event may be overestimating its significance. (For the record, since 1989 it’s never taken the SPX longer than 36 trading days to hit a new all-time high after 1) rebounding from a 10%-or larger correction and 2) trading within 1.5% of the previous record, as it did last week. In the majority of cases, it took two weeks or less.)
History doesn’t show much evidence of a sentiment boost from setting a new record high in these circumstances. The following chart compares the SPX’s median gains after the most recent 13 times it hit a new intraday record high (blue) to its benchmark median returns (green), at intervals ranging from five trading days to six months:1
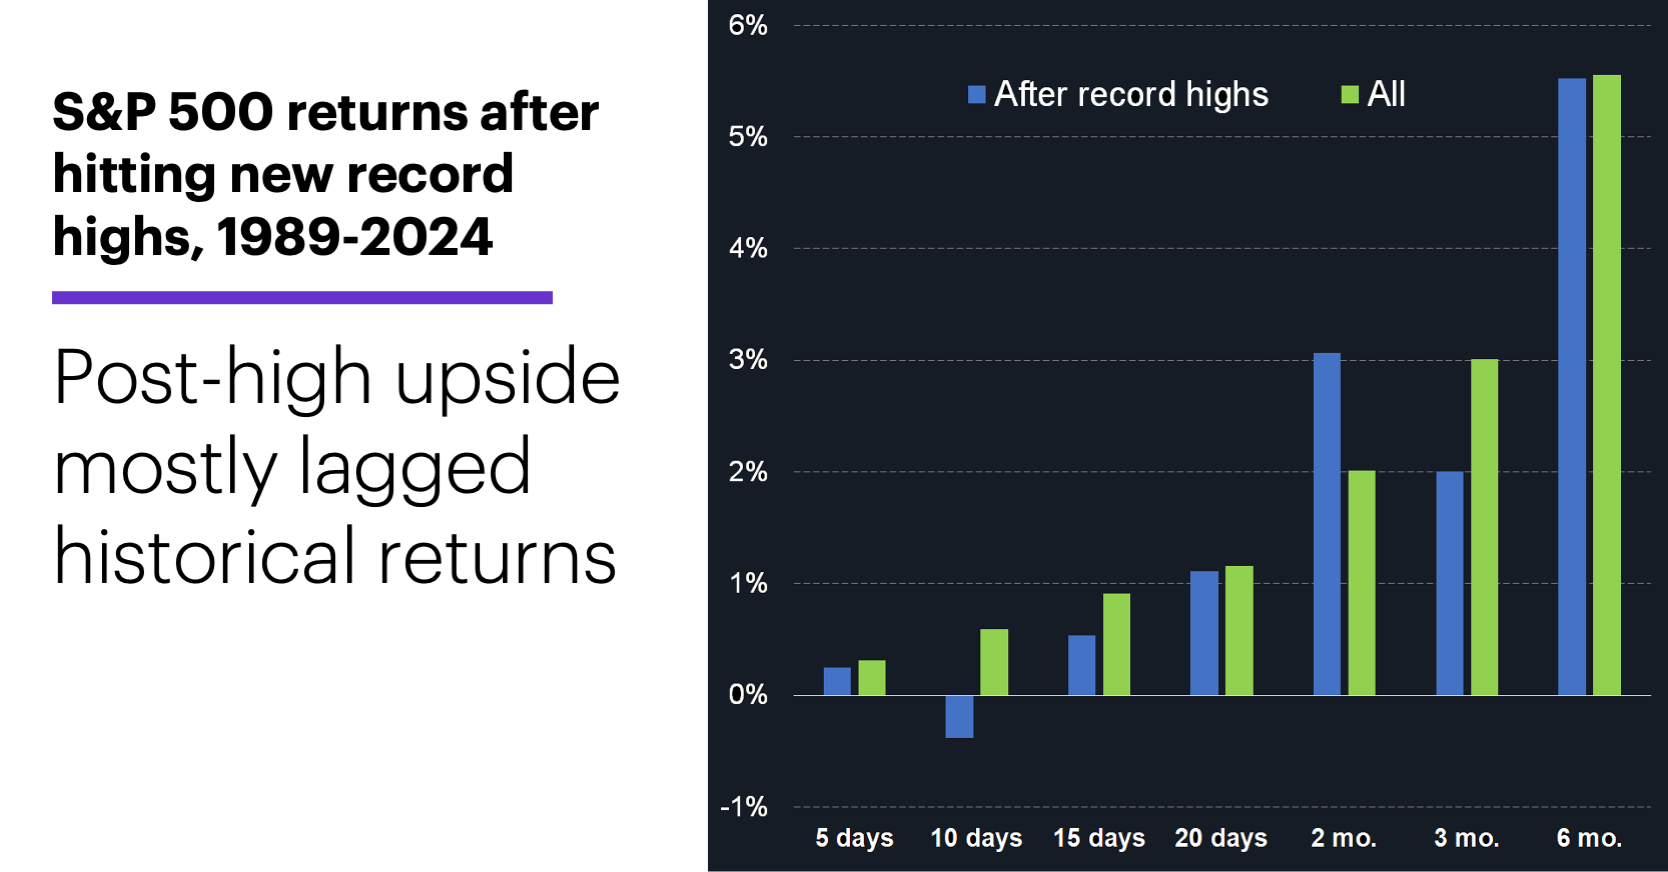
Data source: Power E*TRADE. (For illustrative purposes. Not a recommendation. Note: It is not possible to invest directly in an index.)
While the SPX’s returns after hitting new highs were positive at all of the intervals except one (after 10 trading days), the post-new-high gain only outperformed the benchmarks at the two-month mark.
In other words, while the net result after hitting a new record high was further upside, that upside was sub-par relative to the SPX’s typical historical performance.
Click here to log on to your account or learn more about E*TRADE's trading platforms, or follow the Company on X (Twitter), @ETRADE, for useful trading and investing insights.
1 All figures reflect S&P 500 (SPX) daily price data, 1989-2024. Record/all-time highs refer to intraday highs rather than closing prices. Returns reflect the percentage change from the all-time high to the intraday highs of each successive interval. Supporting document available upon request.