Average performance not necessarily “typical”
- HUM up more than 3% Tuesday, earnings due on July 30
- Stock hit eight-year intraday low last Friday
- Flat average performance figures masked volatility
The health care sector has had a challenging 2025, and while health care insurers are part of the financial sector, the stocks of several of these companies have also suffered significant setbacks this year.
For example, Humana (HUM), which was down 8.9% for the year as of Tuesday (and roughly 60% below its 2022 record high), has been especially volatile over the past several days. Shares rallied nearly 4% intraday on Tuesday, just two days after they hit their lowest low since April 2017:
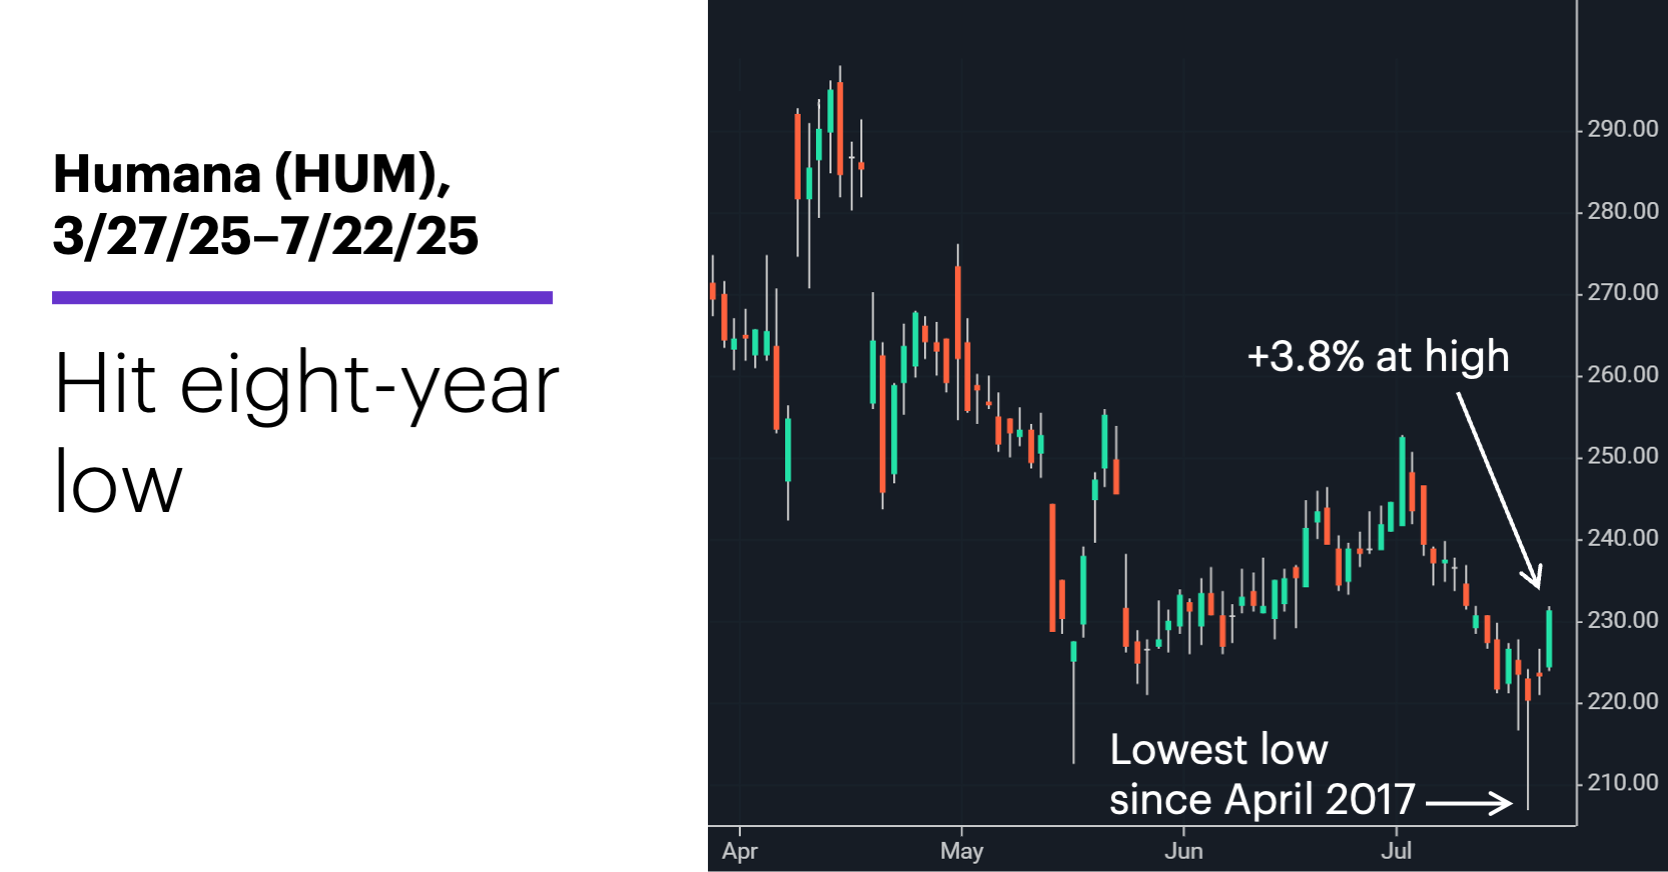
Source: Power E*TRADE. (For illustrative purposes. Not a recommendation.)
Yesterday’s rally followed reports that the company planned to eliminate roughly one-third of prior authorizations for outpatient services by 2026, an attempt to reduce the time-consuming process often associated with getting approvals for treatments such as MRIs and colonoscopies.1
Last Friday’s 7.5% sell-off to an intraday low of $206.87 unfolded in the wake of news that a judge had dismissed the company’s lawsuit seeking to reverse cuts to its Medicare bonus payments that are potentially worth billions of dollars. (The ruling, however, didn’t prevent Humana from appealing the decision or refiling its suit at a later date.)2
These swings came just a little more than a week before the company’s scheduled July 30 earnings announcement. Understandably, many traders and investors are likely thinking about the extent to which HUM’s approaching release may extend its recent choppiness.
It makes sense to consult the stock’s behavior around other earnings releases, but it’s also important to understand some of the nuances of these performance figures. The following table shows HUM’s net returns for three periods—the five trading days before earnings day, earnings day, and the five trading days after earnings day:3
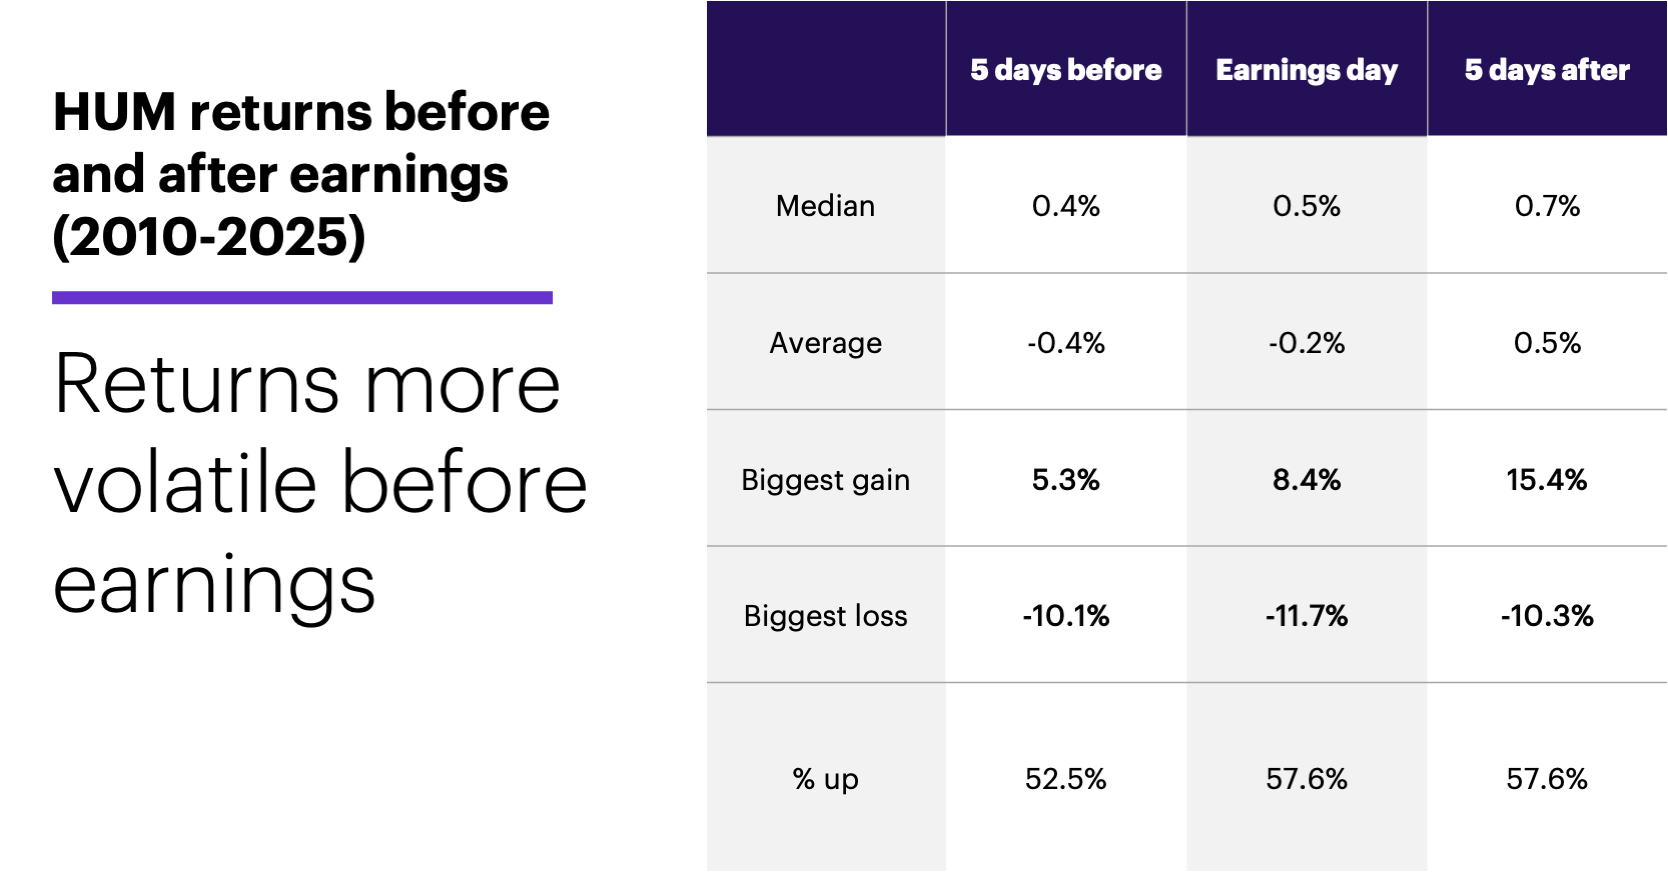
Source: Power E*TRADE. (For illustrative purposes. Not a recommendation.)
The bottom row (“% up”), which represents how often a given return was positive, shows HUM gained ground more often than 50% of the time in all three periods. But unlike the median returns, the average returns for the five days before earnings and earnings day itself were negative.
That suggests an element of volatility. For example, although HUM posted a net gain in the five days before earnings 52.5% of the time, a greater number of large sell-offs vs. large gains pushed the average return into negative territory: The stock fell 4% or more in 11 cases, while gaining 4% or more only six times. The biggest loss for this period was -10.1%, roughly twice the size of the biggest gain (5.3%) in absolute terms. Earnings day was similar: The stock rallied 57.6% of the time, but it fell 5% or more 10 times, while rallying 5% or more only five times.
The five-day period after earnings shows some evidence of a shift. The percentage of up moves was the same as for earnings day (57.6%), but both the median and average returns were positive, and the biggest loss was smaller than the biggest gain on an absolute basis—indications that large declines during this period weren’t as frequent as large gains. In fact, the net loss for this period exceeded -4% eight times, while the net gain was 4% or higher nine times.
Average performance figures can be very useful, but it’s important to remember that they are composites—individual results that can vary quite widely, as shown here. In other words, when contemplating a stock’s potential performance around a specific event (such as earnings), it’s a good idea to understand the range of past individual examples. That can provide a more realistic picture than a historical average of what could happen in any given case.
Today’s numbers include (all times ET): mortgage applications (7 a.m.), existing home sales (10 a.m.), Atlanta Fed business inflation expectations (10 a.m.), EIA Petroleum Status Report (10:30 a.m.).
Today’s earnings include: Freeport McMoRan (FCX), Chipotle (CMG), General Dynamics (GD), Alphabet (GOOGL), International Business Machines (IBM), Mattel (MAT), O'Reilly Automotive (ORLY), QuantumScape (QS), Tesla (TSLA).
Click here to log on to your account or learn more about E*TRADE's trading platforms, or follow the Company on Twitter, @ETRADE, for useful trading and investing insights.
1 Bloomberg. Humana Falls After Losing Bid to Reverse Medicare Bonus Cuts. 7/18/25.
2 Reuters. Humana to reduce about one-third of prior authorization requirements. 7/22/25.
3 All figures represent Humana (HUM) daily prices, 2010-2025. Supporting document available upon request.