Milestone vs. head fake: S&P 500 new highs
- SPX climbed within 1.4% of record high last week
- Index usually hit new high in next four weeks
- “Breakout” momentum the exception, not the rule
With the S&P 500’s (SPX) April correction feeling more distant, and many investors and traders looking ahead to new highs, it’s a good time to take a look at what similar scenarios have meant for the market in the past.
“Geopolitics grabs market spotlight” noted that, if history is any guide, there’s a better-than-average chance the S&P 500 (SPX) could hit new highs sometime in the next seven weeks. But it also showed that while the SPX’s returns in the first six months after hitting new record highs have mostly been positive, they’ve also tended to be weaker than average.
Here’s a closer look at how the SPX traded the other times it pushed to a new (intraday) all-time high after recovering from a 10%-or-larger correction. The following table shows the index’s returns at seven intervals, ranging from five to 126 trading days (one week to roughly six months):
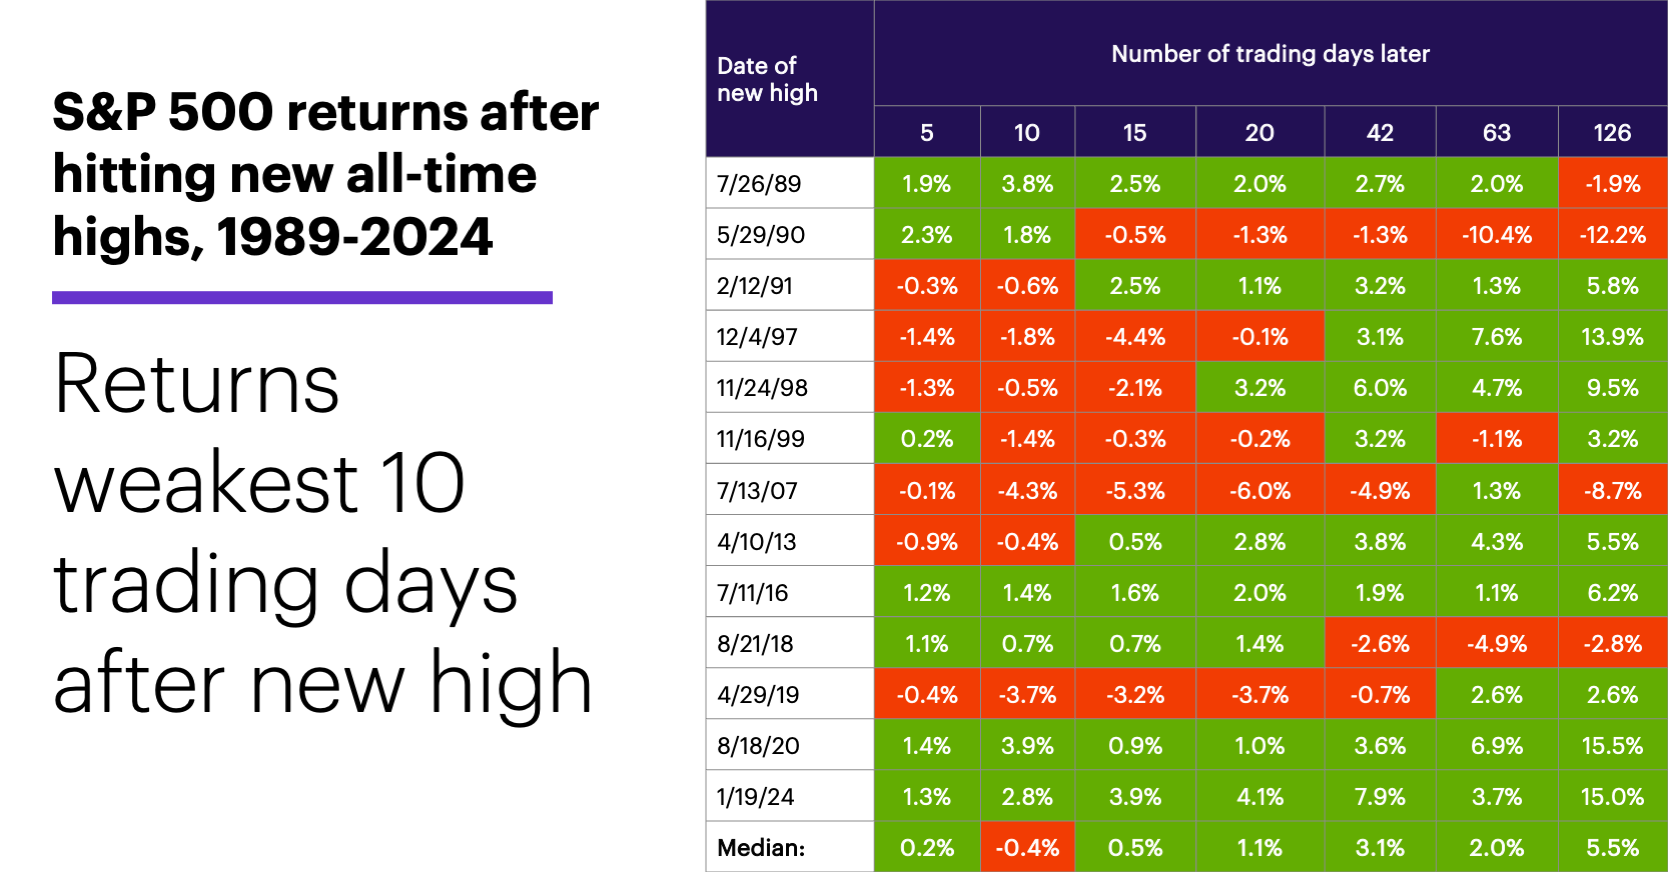
Source (data): Power E*TRADE. (For illustrative purposes. Not a recommendation.)
The SPX appeared to be at its weakest after 10 trading days (two weeks), when it was lower in seven of the 13 cases. After 126 trading days, the index was lower in only four instances.
Charting the data may provide a better idea of how varied the different outcomes were:
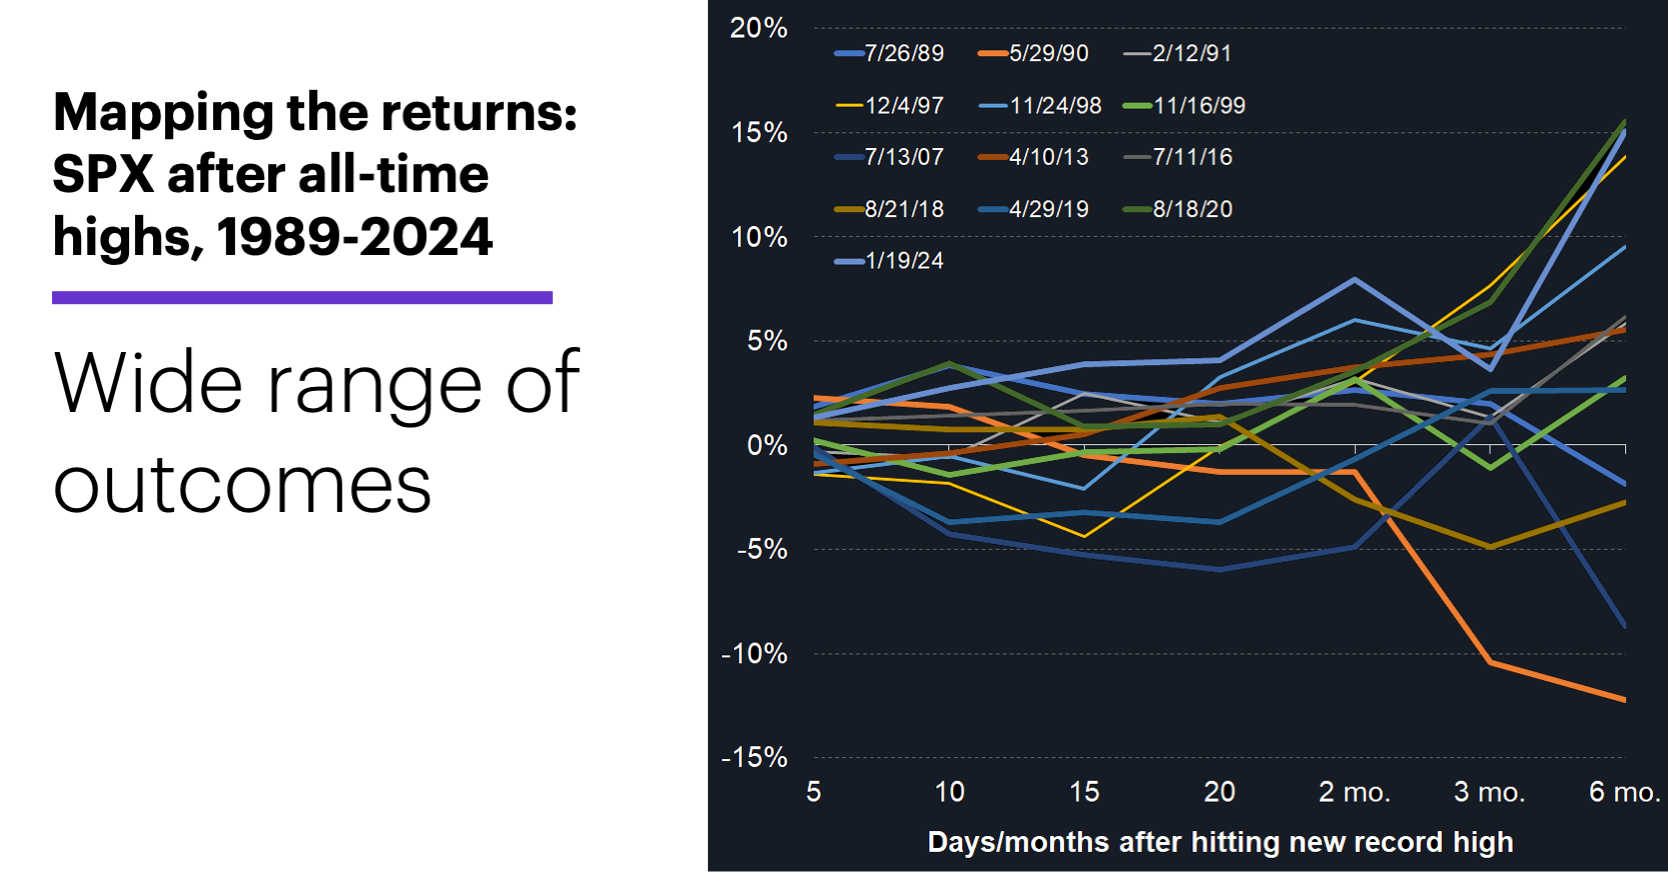
Source (data): Power E*TRADE. (For illustrative purposes. Not a recommendation.)
After six months, the SPX was anywhere from 15.5% higher to 12.2% lower. The average negative return was -6.39%, while the average positive return was 8.59%.
It’s also apparent that the market’s performance in the first couple of weeks after hitting new highs didn’t necessarily indicate how it would perform over the next several months. For example, of the seven times the SPX had a negative return after 10 trading days, it was still in the red only once at the six-month mark.
In other words, while the SPX’s path if and when it hits a new record high will be determined by the unique catalysts and constraints in force at that time, history suggests traders shouldn’t expect too much in the way of short-term “breakout” momentum.
Market Mover Update: The stock market’s Monday rebound from Friday’s geopolitical shock was mirrored in the oil market’s retreat. August WTI crude oil futures (CLQ5) fell more than 4% intraday and closed down more than 2%, even though Israel’s military strikes had expanded to include Iran’s oil and gas infrastructure.
Today’s numbers include (all times ET): FOMC meeting starts, retail sales (8:30 a.m.), import and export prices (8:30 a.m.), industrial production (9:15 a.m.), business inventories (10 a.m.), NAHB Housing Market Index (10 a.m.).
Today’s earnings include (all times ET): Jabil (JBL), John Wiley & Sons (WLY), La-Z-Boy (LZB).
Click here to log on to your account or learn more about E*TRADE's trading platforms, or follow the Company on Twitter, @ETRADE, for useful trading and investing insights.