Market Dashboard
New every Monday with last week’s recap and notes on the week ahead.
Last update: 2/23/2026
Stocks advanced over the holiday-shortened week as investors shifted money into real-asset industries like energy and materials. Treasury yields rose as the Fed sounded more cautious on inflation. A key December inflation reading ran slightly hotter than forecast, while fourth quarter gross domestic product growth was much slower than expected.
Stocks rise as sector leadership shifts
- U.S. equities advanced over the holiday-shortened week as worries about artificial intelligence disruption eased and economic data held up. Stock-by-stock performance differences rose.
- The S&P 500 Index closed up 1.1% for the week at 6,910.
- The Nasdaq Composite Index rose 1.5%.
- The small-cap Russell 2000 Index ticked up 0.6%.
- Sector rotations: Investors continued to shift money into Energy and Materials, which have led the market year to date, while pulling back from Financials and Information Technology, which have lagged.
- Volatility stayed elevated, even as investors looked past geopolitical and policy headlines, with Cboe Volatility Index (VIX) hovering around 19 as of Friday afternoon.
Economic growth slows as shutdown hits activity
- U.S. gross domestic product (GDP) came in much weaker than expected in the fourth quarter (Q4) of 2025, as a record-long government shutdown, cooler consumer spending, and contracting trade weighed on growth.
- Headline GDP rose 1.4% year-over-year in Q4 2025—well below Wall Street’s expectations of 2.8% and down sharply from the third quarter’s 4.4% annualized growth. Full-year 2025 GDP growth was 2.2%.
- The Bureau of Economic Analysis (BEA) estimated that the reduction in federal government services during the shutdown subtracted about 1.0 percentage point from Q4 inflation-adjusted GDP growth.
- Consumer spending growth cooled 1.1% from the prior quarter to 2.4%, with weaker goods spending but stronger services spending.
- Business investment rose 1.7% in the quarter, supported by artificial intelligence-related spending. However, investment excluding artificial intelligence-related components declined.
Inflation firms as PCE runs hotter than expected
- December headline personal consumption expenditures (PCE) price inflation came in slightly hotter than expected.
- Headline PCE rose 0.4% month-over-month and 2.9% year-over-year.
- Core PCE (the Federal Reserve’s preferred inflation gauge, excluding food and energy) also rose 0.4% month-over-month, driven by an uptick in goods inflation.
- Personal spending increased 0.4% in December, outpacing personal income growth of 0.3%.
- The personal savings rate fell to 3.6% in December, implying households may have a smaller buffer to support spending.
Fed minutes lean hawkish as yields rise
- January Federal Open Market Committee (FOMC) meeting minutes leaned hawkish, describing a “solid pace” of expansion and a potentially stabilizing labor market.
- The minutes also noted several participants thought additional rate hikes may be appropriate if inflation remains elevated.
- Market-implied expectations for a 25-basis-point Fed rate cut in March fell to 5%.
- The estimated number of 25-basis-point Fed cuts through end-2026 drifted lower to 2.2.
- Yields rise: Two-year Treasury yields increased 7 basis points to 3.48% last week, while 10-year Treasury yields rose 3 basis points to 4.08%.
Manufacturing stays uneven despite production gain
- Industrial production grew 0.7% in January and advanced 0.5% from December. Stronger business equipment production and manufacturing output helped drive the gain.
- February S&P Global Manufacturing PMI missed estimates but stayed in expansion territory at 51.2 (above 50 typically signals expansion).
Durable goods fall less than expected
- Headline durable goods declined 1.4% for December, a smaller drop than expected.
- The decline followed November’s 5.4% gain and reflected weaker transportation equipment orders.
Housing improves as mortgage rates fall
- Housing conditions improved as 30-year fixed mortgage rates fell to around 6.2%—near late-2022 levels—as of Friday afternoon.
- December housing starts rose to 1.404 million, the highest level since July 2025. Single-family housing starts rose 4.1% in December.
- National Association of Home Builders (NAHB) sentiment slipped to 36 in February, below expectations, with affordability still a key challenge and buyers staying cautious despite incentives.
CRC# 5241743 (02/2026)
How can E*TRADE from Morgan Stanley help?
Undervalued large firms
Consider putting your money in large companies whose stocks may be underpriced based on the principles of value investing.
Hedging with gold
Discover ways to diversify into a precious metal that many investors consider a potential safe haven when the economy slumps.
Futures
Like options, futures let you lock in a price now for an investment you’ll buy in the future. They cost much less than the actual investment, so you can control a large contract with a relatively small amount of capital.
Certificates of Deposit (CD)
Fixed rates. Annual Percentage Yield up to 1,2
Lock in a competitive fixed rate for terms from to .3
Morgan Stanley Private Bank, Member FDIC.
Cross-Asset Performance Table
Returns and prices of the most popular indices and assets as of 02/20/26.
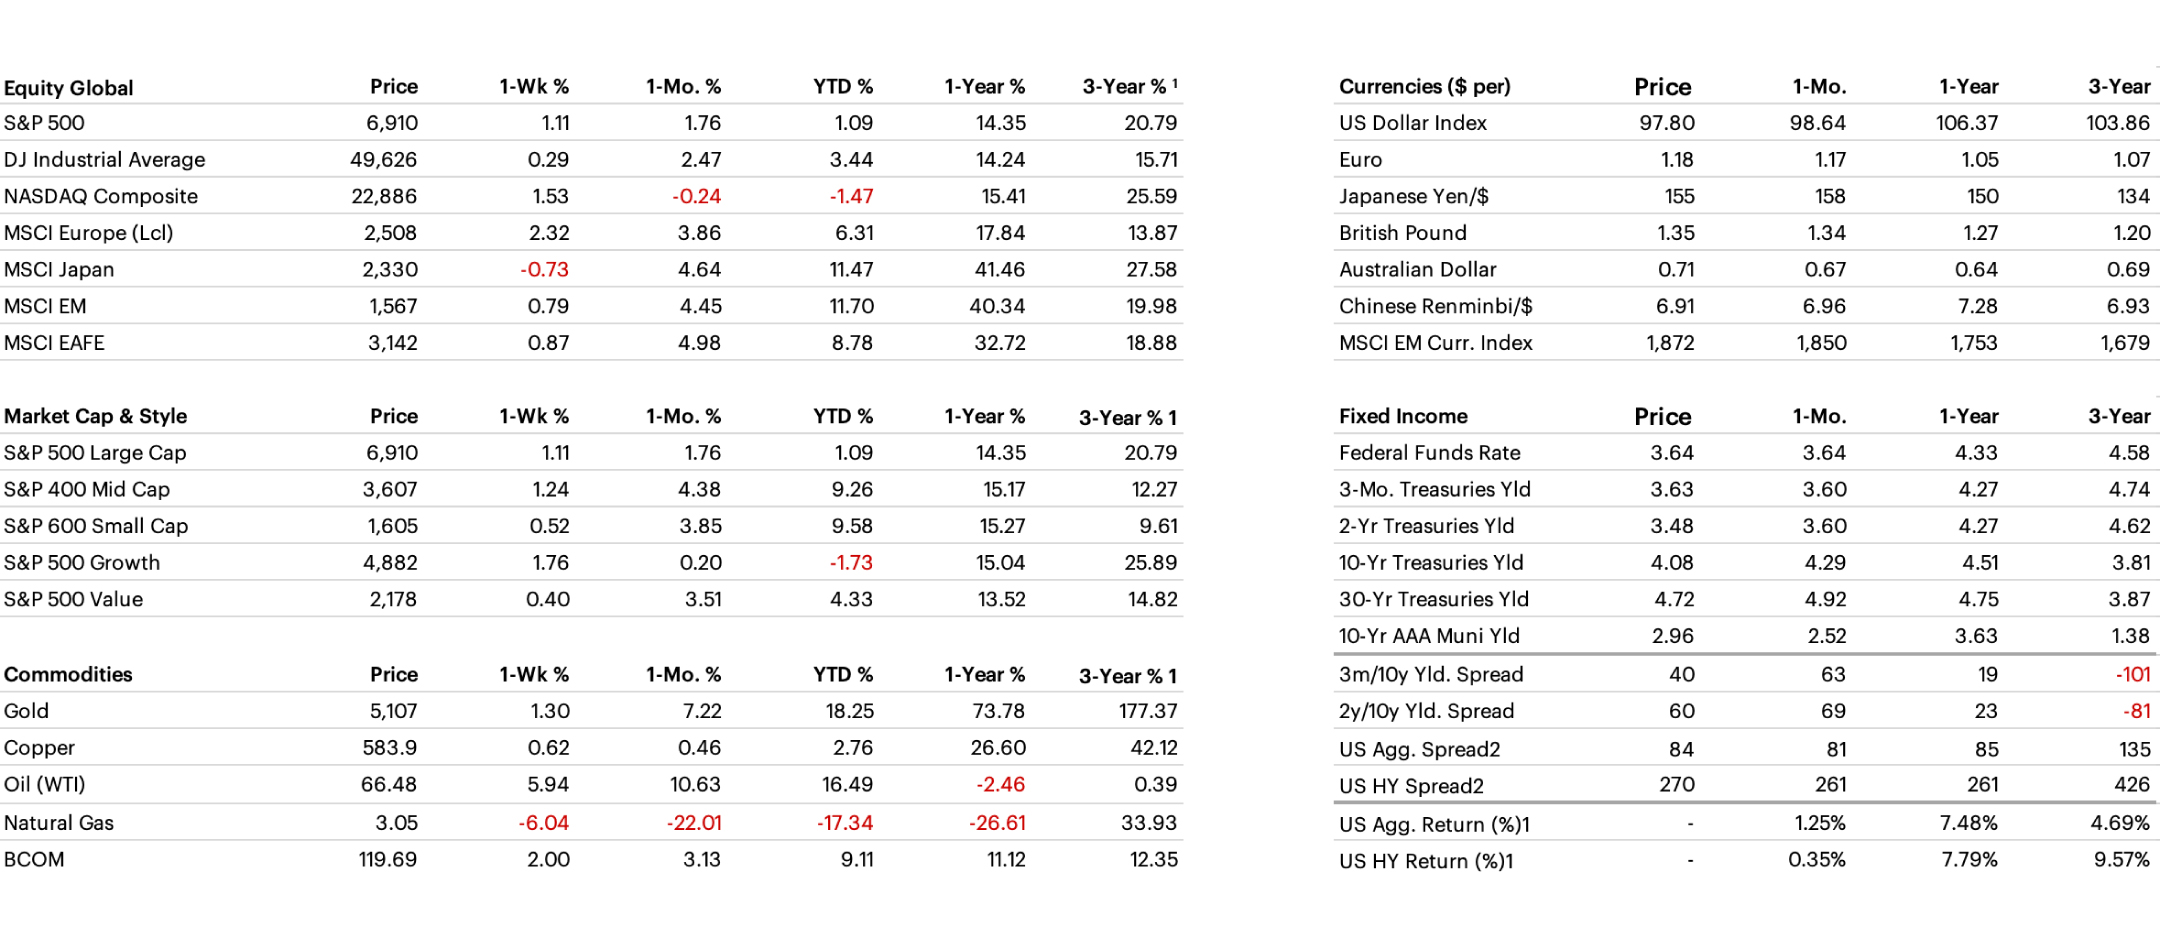
1) Annualized 3-year % return. 2) Option Adjusted Spread (OAS): OAS is a measurement of the spread of a fixed income security rate and the risk-free rate of return, which is adjusted to take into account an embedded option. Equity risk premium is the excess return that an individual stock or the overall stock market provides over a risk-free rate. The risk-free rate represents the interest an investor would expect from an absolutely risk-free investment over a specified period of time. Past performance is not indicative of future results.
S&P 500 Sector Performance
Communication Services and Industrials were the strongest-performing S&P 500 sectors last week, while Health Care and Consumer Staples lagged.
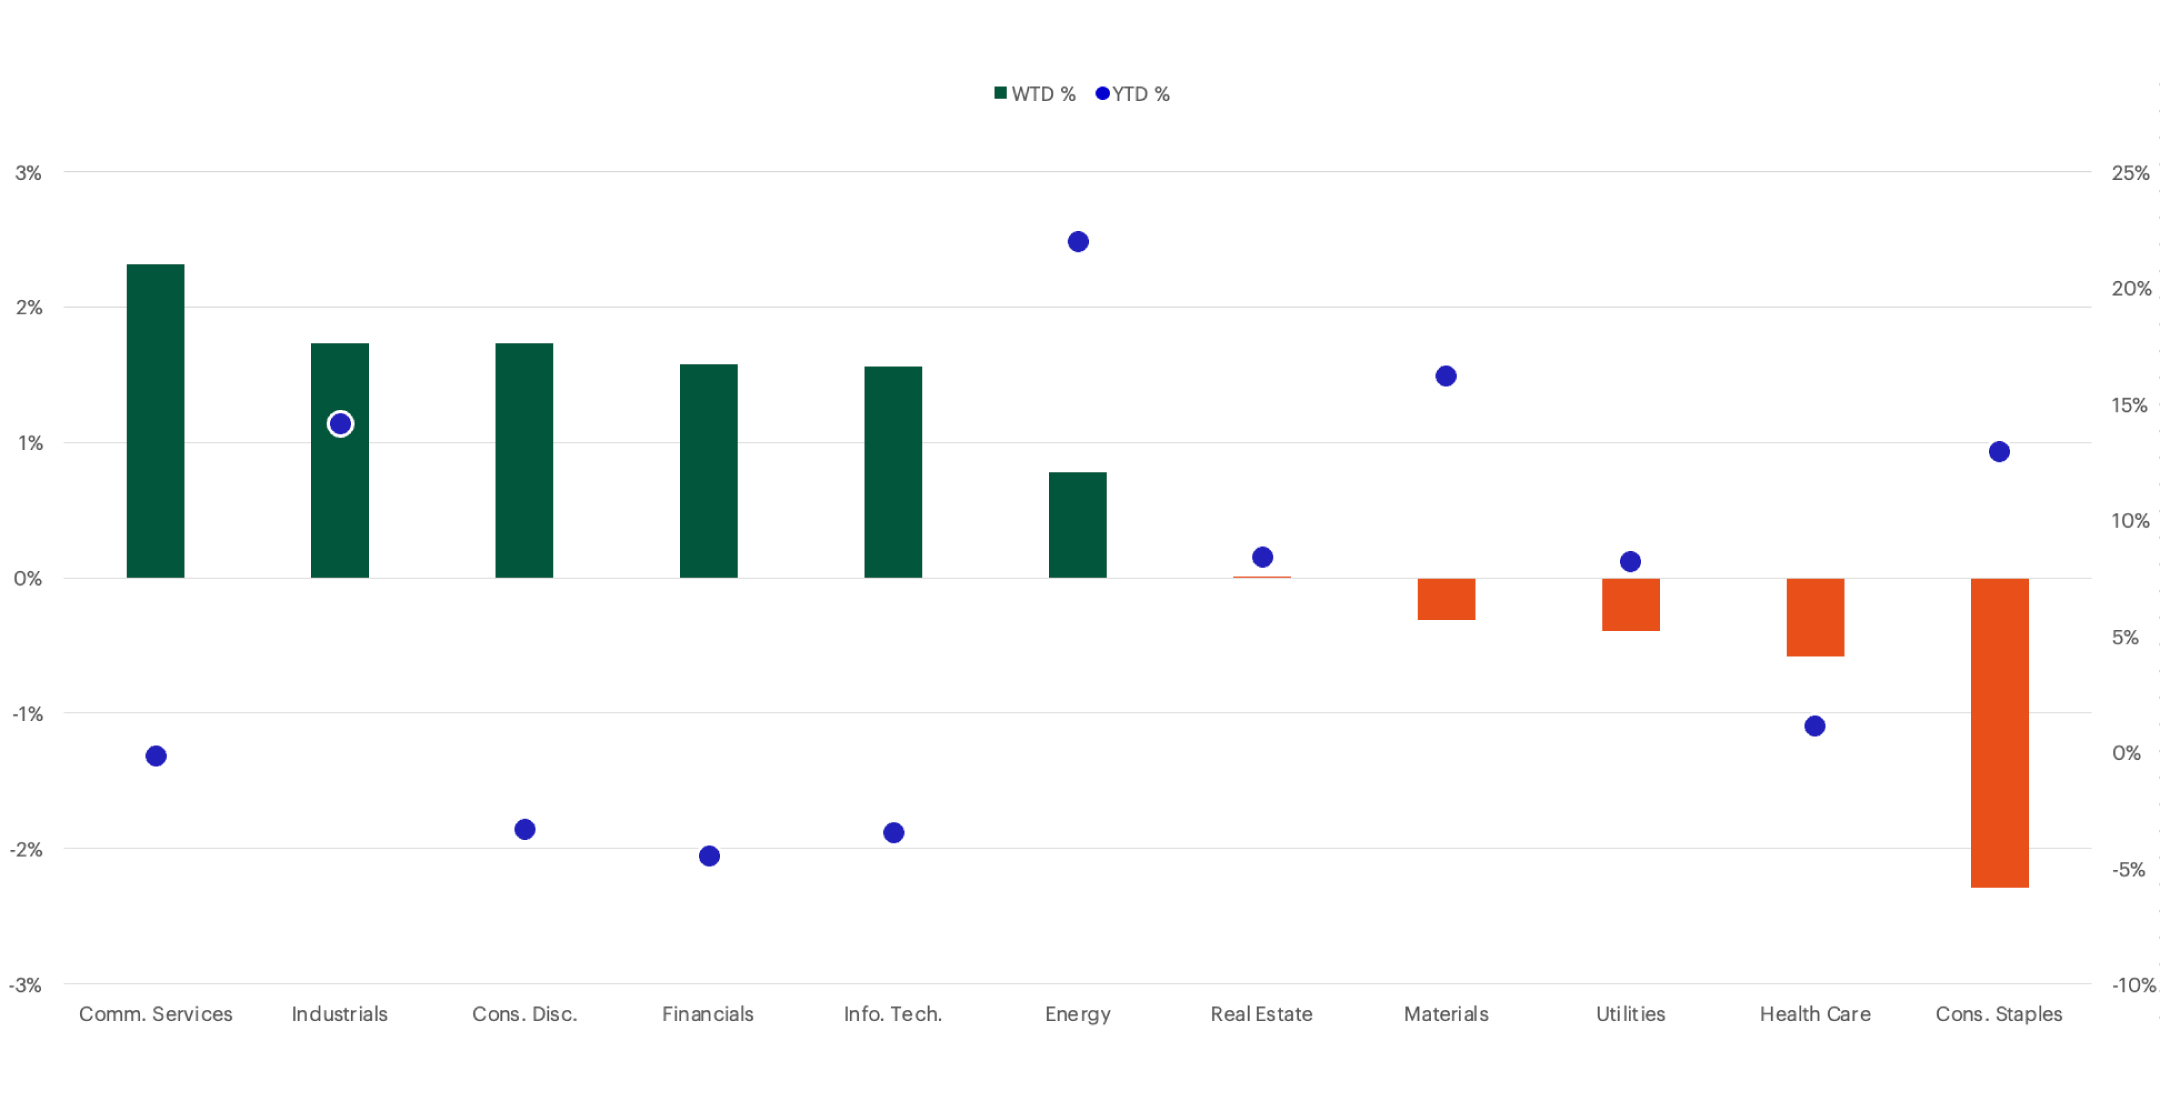
Past performance is not indicative of future results.
Russell US Equity Style Performance
Large-cap stocks outperformed small-cap equities.
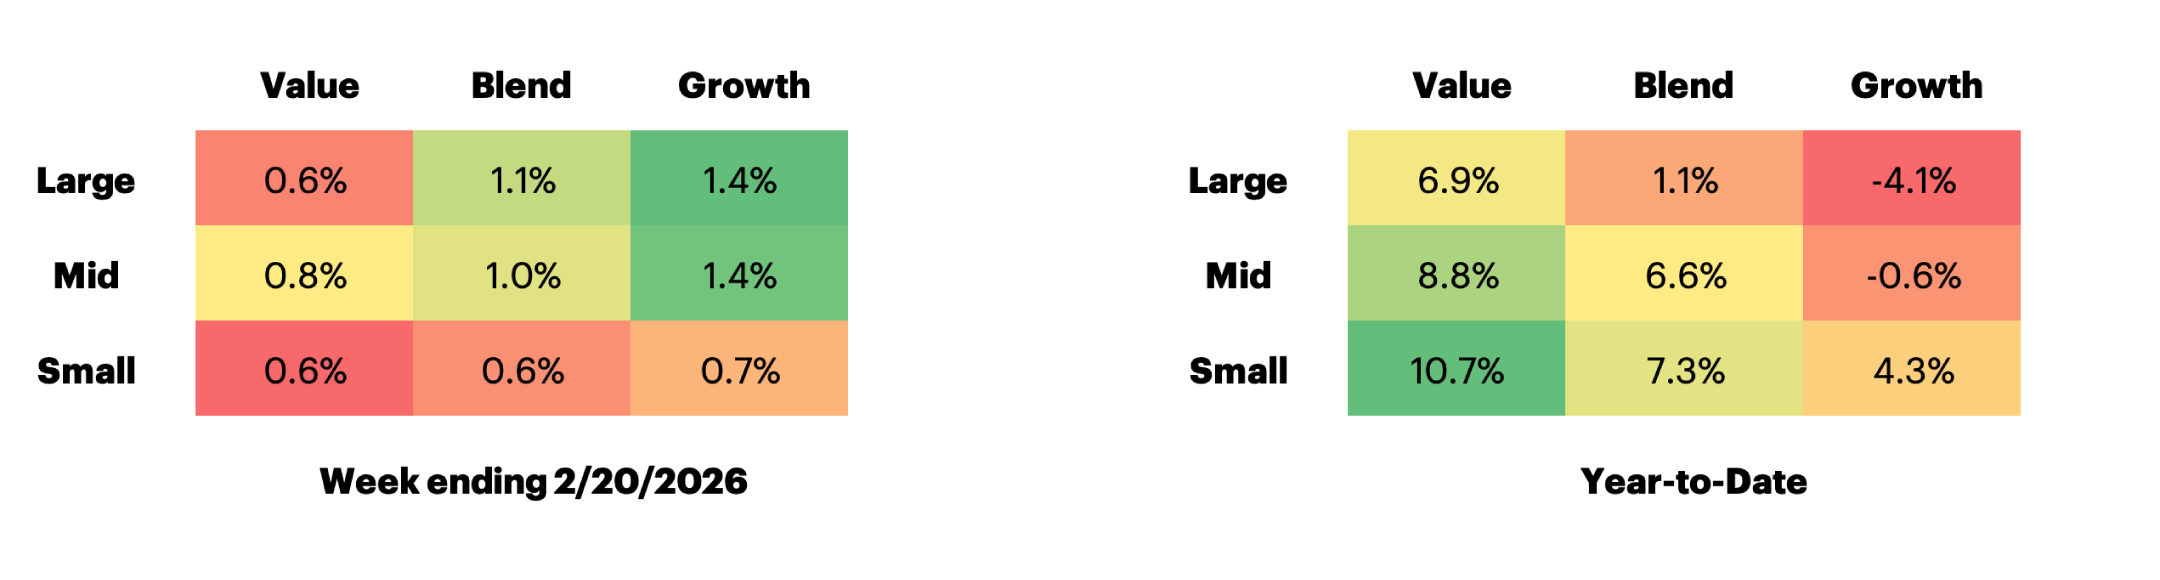
Past performance is not indicative of future results.
US Equity Valuation
S&P 500 Equity Risk Premium
Bonds continue to appear attractive relative to equities.
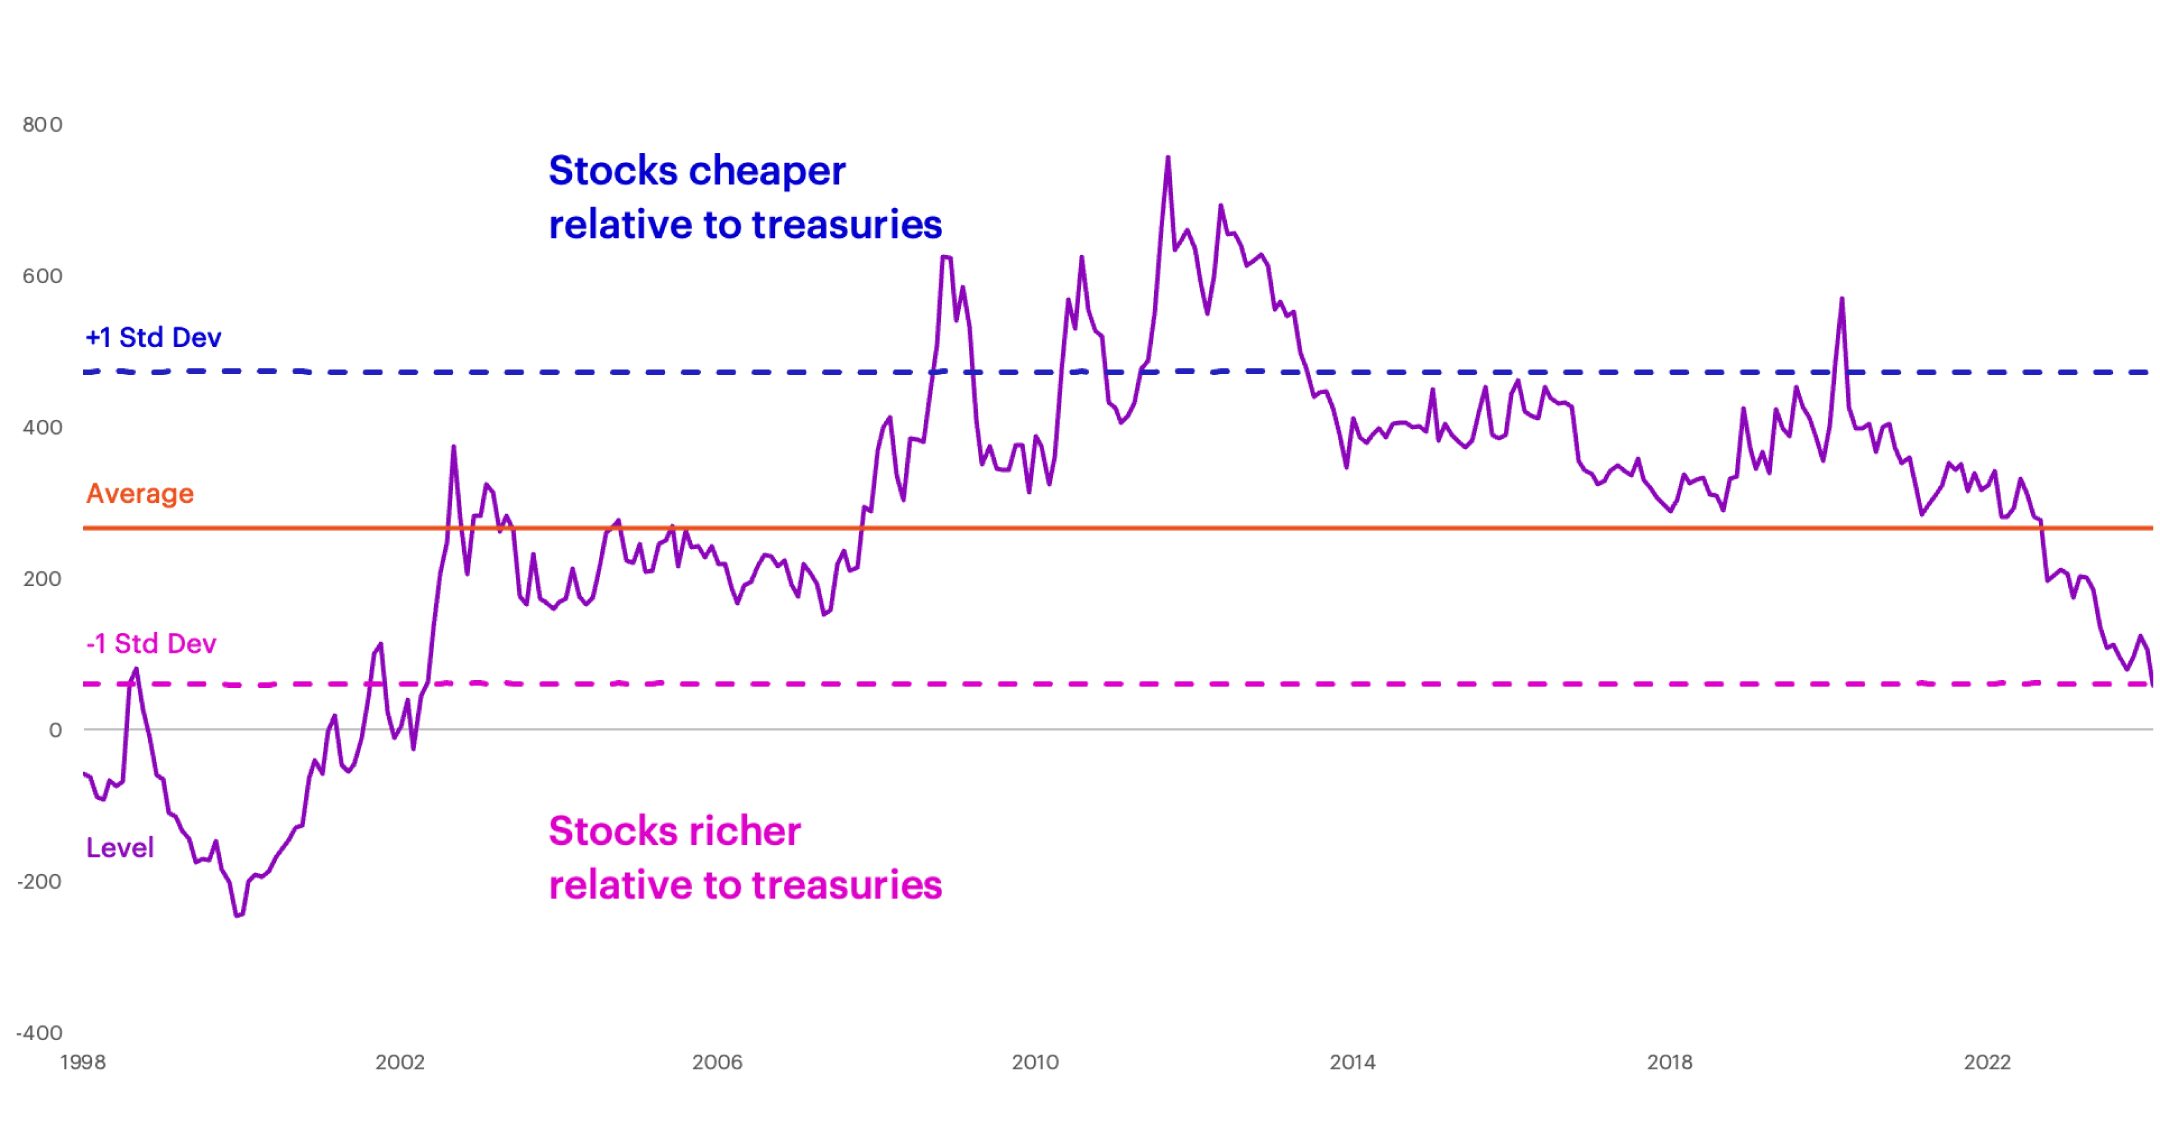
Past performance is not indicative of future results.
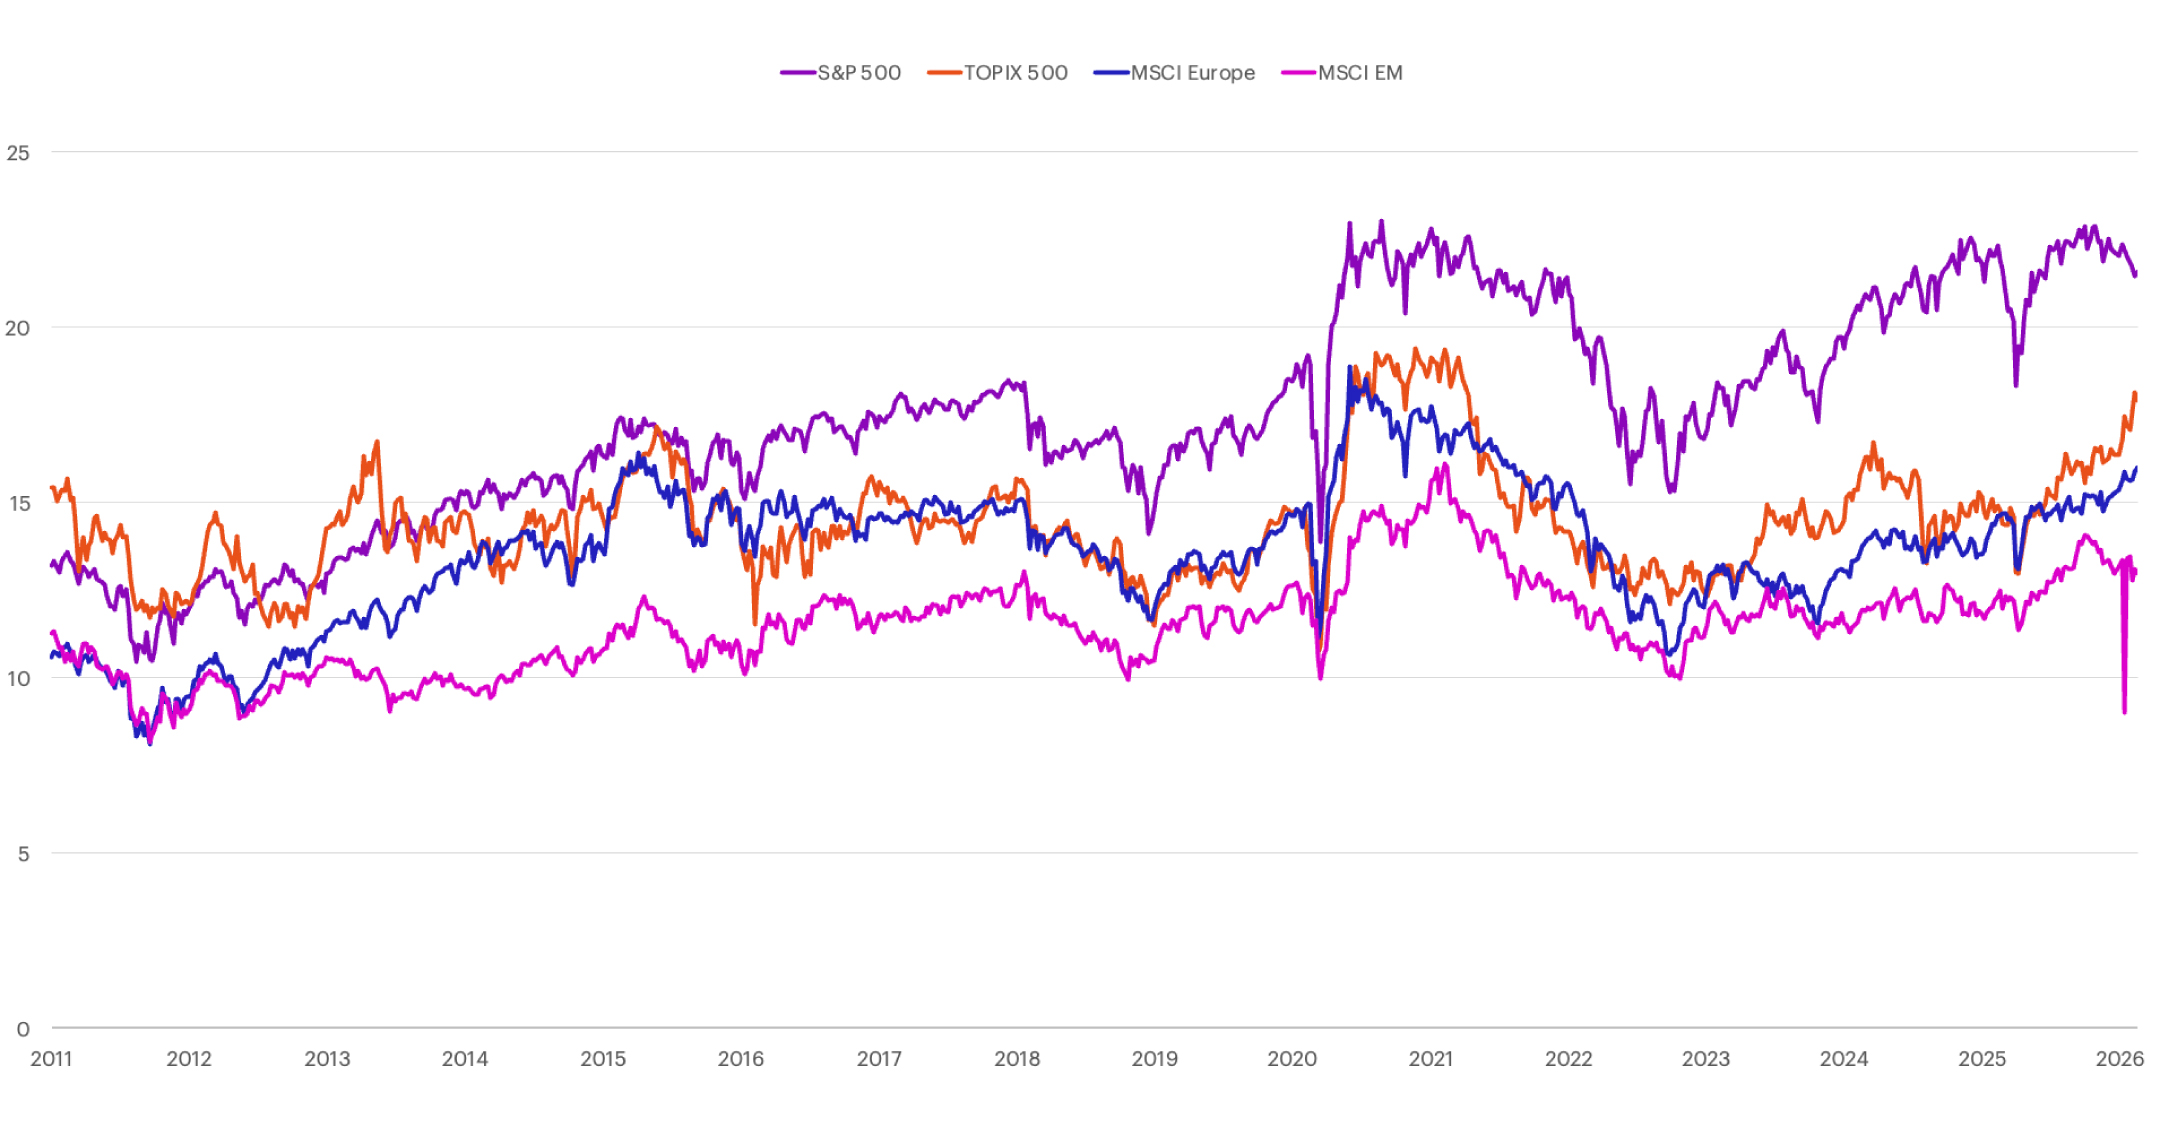
P/E Relative to Rest of World
The S&P 500 remains expensive relative to the rest of the world.
Past performance is not indicative of future results.
US Fixed Income Valuation
Two-year Treasury yields increased 7 basis points to 3.48% last week, while 10-year Treasury yields rose 3 basis points to 4.08%.
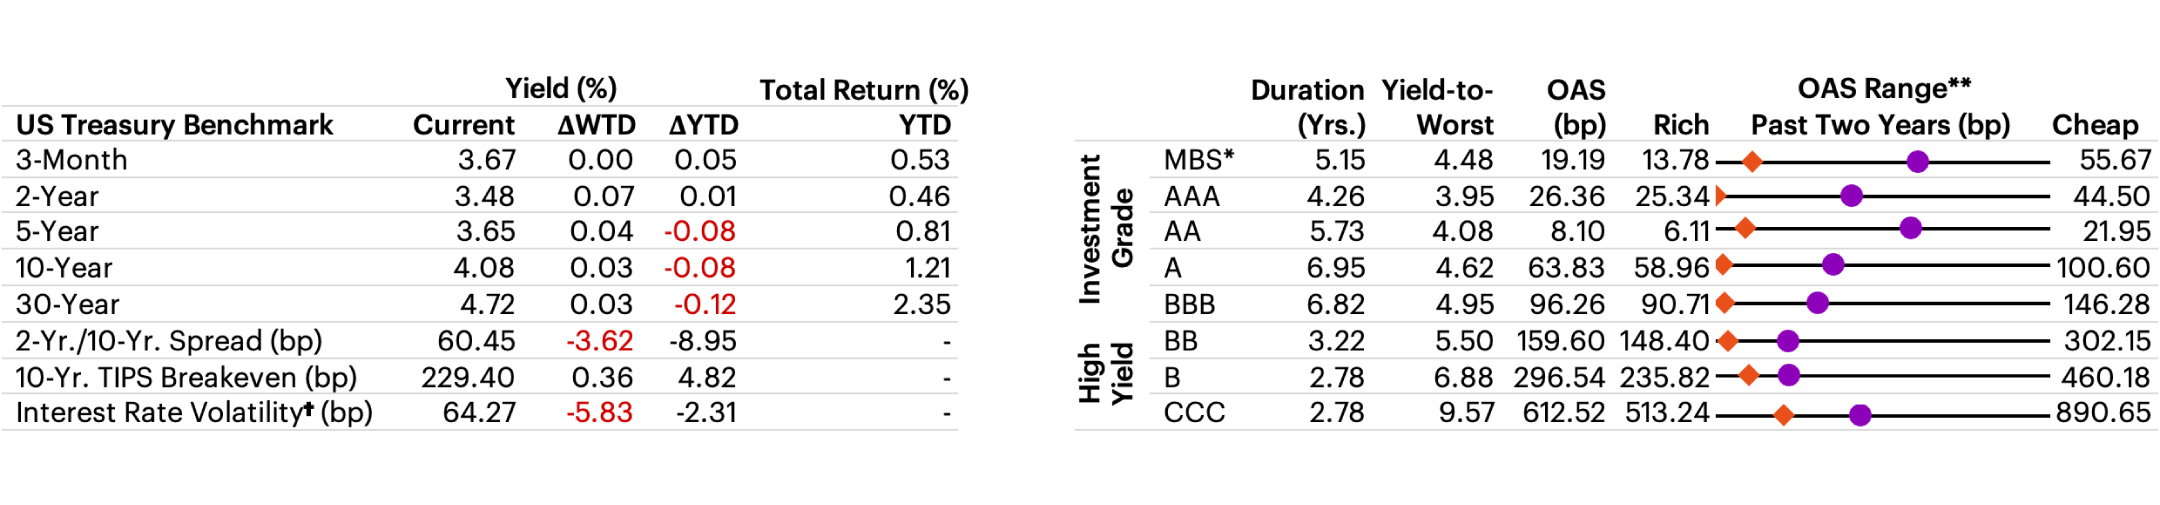
†Interest Rate Volatility as measured by ICE BofAML Option Volatility Estimate Index (MOVE); *Mortgage-backed securities (MBS) are debt obligations that represent claims to the cash flows from pools of mortgage loans, most commonly on residential property. Mortgage loans are purchased from banks, mortgage companies, and other originators and then assembled into pools by a governmental, quasi-governmental, or private entity; **Options Adjusted Spread (OAS): A measurement of the spread of a fixed income security rate and the risk-free rate of return, which is adjusted to take into account an embedded option. Past performance is not indicative of future results.
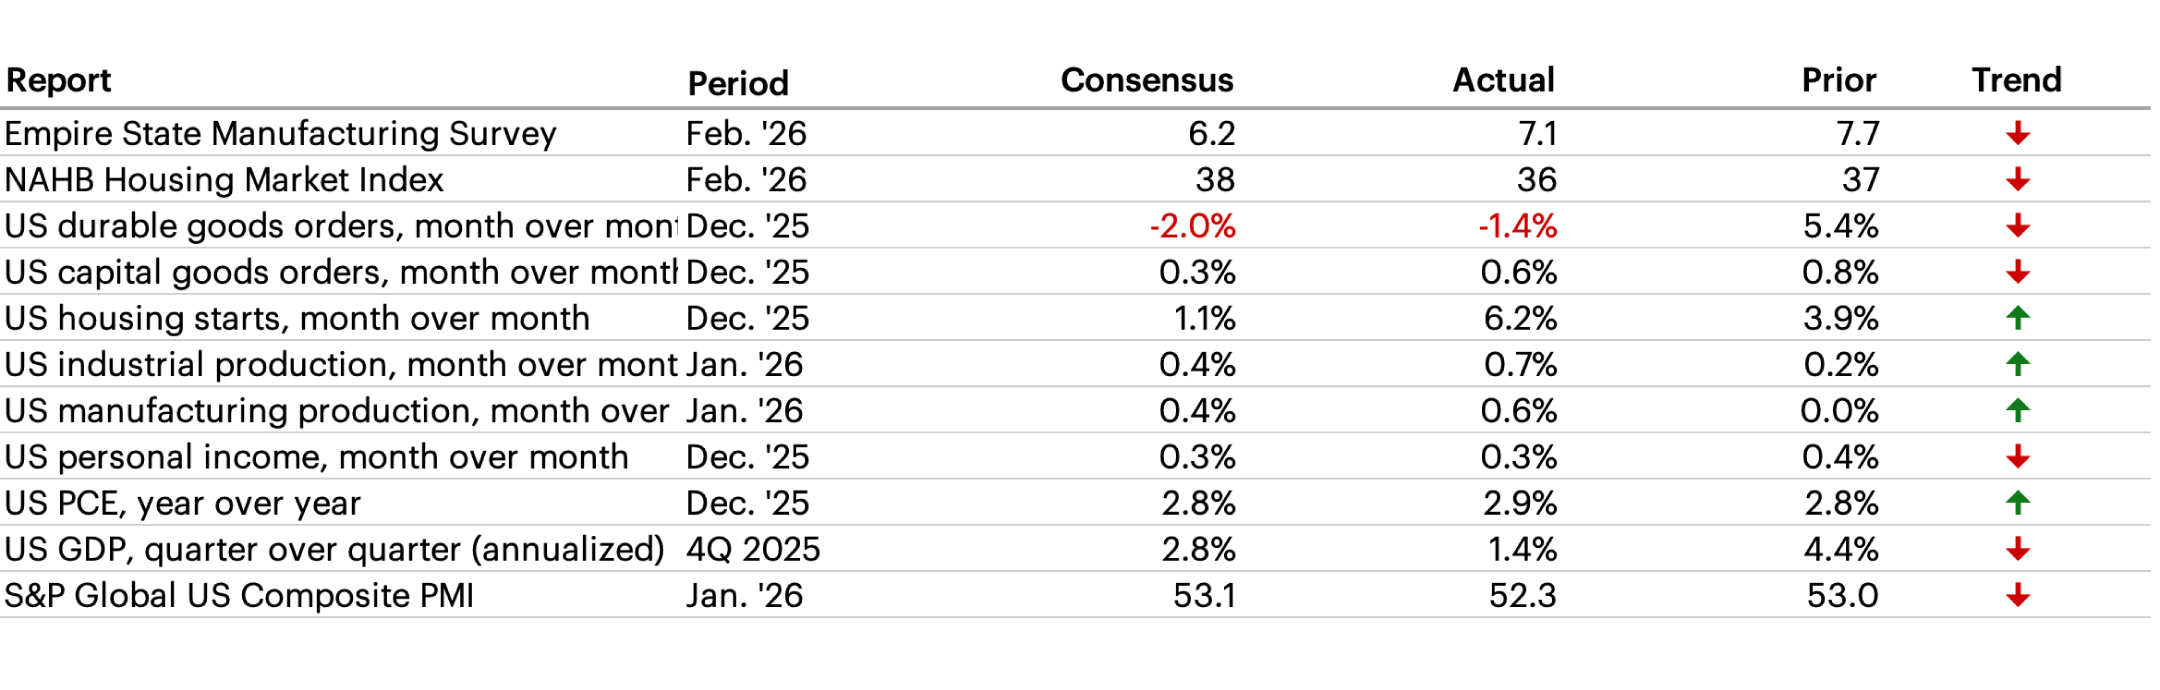
Latest Economic Data
Headline GDP rose 1.4% year-over-year in Q4 2025—well below Wall Street’s expectations of 2.8% and down sharply from the third quarter’s 4.4% annualized growth. Full-year 2025 GDP growth was 2.2%. The Bureau of Economic Analysis (BEA) estimated that the reduction in federal government services during the shutdown subtracted about 1.0 percentage point from Q4 inflation-adjusted GDP growth.
The Week Ahead
The week ahead includes readings from the Conference Board consumer confidence surveys, the Producer Price Index (PPI), factory orders, and several regional Fed surveys.
- Chicago Fed National Activity Index at 8:30 AM ET
- US factory orders at 10:00 AM ET
- Dallas Fed Manufacturing Index at 10:30 AM ET
- Conf. Board Consumer Confidence Index at 10:00 AM ET
- US wholesale trade sales at 10:00 AM ET
- Dallas Fed Services Activity Index at 10:30 AM ET
- Home Depot, Inc. (The) Reports Earnings
- NVIDIA Corporation Reports Earnings
- US initial jobless claims at 8:30 AM ET
- US continuing jobless claims at 8:30 AM ET
- Kansas City Fed Manufacturing Activity at 11:00 AM ET
- US PPI at 8:30 AM ET
- Berkshire Hathaway Inc. Reports Earnings
Index benchmarks
Cross-Asset Performance
S&P 500: A market capitalization-weighted index of 500 widely held stocks often used as a proxy for the stock market. It measures the movement of the largest issues. Standard and Poor's chooses the member companies for the 500 based on market size, liquidity and industry group representation. Included are the stocks of industrial, financial, utility, and transportation companies. Since mid-1989, this composition has been more flexible and the number of issues in each sector has varied. The returns presented for the S&P 500 are total returns, including the reinvestment of dividends each month.
Dow Jones Industrial Average: Computed by summing the prices of the stocks of 30 companies and then dividing that total by an adjusted value—one which has been adjusted over the years to account for the effects of stock splits on the prices of the 30 companies. Dividends are reinvested to reflect the actual performance of the underlying securities.
NASDAQ Composite: Measures the performance of all issues listed in the NASDAQ Stock Market, except for rights, warrants, units, and convertible debentures. Morningstar reports the NASDAQ Composite as a price return.
MSCI Europe IMI: This index captures large, mid and small cap representation across 16 Developed Markets countries in Europe. With 1,372 constituents, the index covers approximately 99% of the free float-adjusted market capitalization across the Developed Markets countries of Europe.
MSCI Japan IMI: This index is designed to measure the performance of the large, mid and small cap segments of the Japan market. With 1,134 constituents, the index covers approximately 99% of the free float-adjusted market capitalization in Japan.
MSCI EM (Emerging Markets) Index: A free float-adjusted market-capitalization index that is designed to measure equity market performance of emerging markets. The MSCI Emerging Markets Index consists of the following 23 emerging market country indexes: Brazil, Chile, China, Colombia, Czech Republic, Egypt, Greece, Hungary, India, Indonesia, Korea, Malaysia, Mexico, Peru, Philippines, Poland, Qatar, Russia, South Africa, Taiwan, Thailand, Turkey and United Arab Emirates. For more information, visit the MSCI web site.
MSCI EAFE (Europe, Australasia, Far East) Index: A free float-adjusted market-capitalization index that is designed to measure the equity market performance of developed markets, excluding the U.S. and Canada. The MSCI EAFE Index consists of the following 21 developed market country indexes: Australia, Austria, Belgium, Denmark, Finland, France, Germany, Hong Kong, Ireland, Israel, Italy, Japan, the Netherlands, New Zealand, Norway, Portugal, Singapore, Spain, Sweden, Switzerland, and the United Kingdom. For more information, visit the MSCI website.
S&P 400 Index: This index provides investors with a benchmark for mid-sized companies. The index measures the performance of mid-sized companies, reflecting the distinctive risk and return characteristics of this market segment.
S&P 600 Index: This index measures the small-cap segment of the U.S. equity market. The index is designed to track companies that meet specific inclusion criteria to ensure that they are liquid and financially viable.
S&P 500 Growth: This index is a style-concentrated index designed to track the performance of stocks that exhibit the strongest growth characteristics by using a style-attractiveness-weighting scheme.
S&P 500 Value: This index is a style-concentrated index designed to track the performance of stocks that exhibit the strongest value characteristics by using a style-attractiveness-weighting scheme.
Bloomberg Commodity Index: Made up of 22 exchange-traded futures on physical commodities. The index currently represents 20 commodities, which are weighted to account for economic significance and market liquidity.
US Trade-Weighted Dollar Index: A weighted average of the foreign exchange value of the US dollar against a subset of the broad index currencies that circulate widely outside the US.
MSCI Emerging Markets Currency Index: sets the weights of each currency equal to the relevant country weight in the MSCI Emerging Markets Index.
Bloomberg US Aggregate Index: The US Aggregate Index covers the dollar-denominated investment-grade fixed-rate taxable bond market, including Treasuries, government-related and corporate securities, MBS pass-through securities, asset-backed securities, and commercial mortgage-based securities. These major sectors are subdivided into more specific sub-indices that are calculated and published on an ongoing basis. Total return comprises price appreciation/depreciation and income as a percentage of the original investment. This index is rebalanced monthly by market capitalization.
Bloomberg US Corporate High Yield Bond Index: This index is composed of fixed-rate, publicly issued, non-investment grade debt.
S&P Sector Performance
The S&P 500 Consumer Discretionary sector comprises those companies included in the S&P 500 that are classified as members of the consumer discretionary sector.
The S&P 500 Consumer Staples sector comprises those companies included in the S&P 500 that are classified as members of the consumer staples sector.
The S&P 500 Energy sector comprises those companies included in the S&P 500 that are classified as members of the energy sector.
The S&P 500 Financials sector comprises those companies included in the S&P 500 that are classified as members of the financial sector.
The S&P 500 Health Care sector comprises those companies included in the S&P 500 that are classified as members of the health care sector.
The S&P 500 Industrials Sector comprises those companies included in the S&P 500 that are classified as members of the industrials sector.
The S&P 500 Information Technology Sector comprises those companies included in the S&P 500 that are classified as members of the information technology sector.
The S&P 500 Materials Sector comprises those companies included in the S&P 500 that are classified as members of the materials sector.
The S&P 500 Communications Services Sector comprises those companies included in the S&P 500 that are classified as members of the telecommunications services sector.
The S&P 500 Utilities Sector comprises those companies included in the S&P 500 that are classified as members of the utilities sector.
The S&P 500 Real Estate Sector comprises those companies included in the S&P 500 that are classified as members of the real estate sector.
US Equity Style Performance
Weekly and monthly style performance charts use Russell 1000, Russell Mid Cap, and Russell 2000 style indexes to represent large cap, mid cap, and small cap respectively.
Russell 1000: Consists of the 1000 largest companies within the Russell 3000 index. Also known as the Market-Oriented Index, because it represents the group of stocks from which most active money managers choose. The returns we publish for the index are total returns, which include reinvestment of dividends. Frank Russell Company reports its indexes as one-month total returns.
Russell 1000 Growth: Market-capitalization weighted index of those firms in the Russell 1000 with higher price-to-book ratios and higher forecasted growth values. The Russell 1000 includes the largest 1000 firms in the Russell 3000, which represents approximately 98% of the investable US equity market.
Russell 1000 Value: Market-capitalization weighted index of those firms in the Russell 1000 with lower price-to-book ratios and lower forecasted growth values. The Russell 1000 includes the largest 1000 firms in the Russell 3000, which represents approximately 98% of the investable US equity market.
Russell 2000: Consists of the smallest 2000 companies in the Russell 3000 Index, representing approximately 7% of the Russell 3000 total market capitalization. The returns we publish for the index are total returns, which include reinvestment of dividends.
Russell 2000 Growth: Market-weighted total return index that measures the performance of companies within the Russell 2000 Index having higher price-to-book ratios and higher forecasted growth values. The Russell 2000 Index includes the 2000 firms from the Russell 3000 Index with the smallest market capitalizations. The Russell 3000 Index represents 98% of the of the investable US equity market.
Russell 2000 Value: Market-weighted total return index that measures the performance of companies within the Russell 2000 Index having lower price-to-book ratios and lower forecasted growth values. The Russell 2000 Index includes the 2000 firms from the Russell 3000 Index with the smallest market capitalizations. The Russell 3000 Index represents 98% of the of the investable US equity market.
Russell Midcap: Measures the performance of the 800 smallest companies in the Russell 1000 Index, which represent approximately 25% of the total market capitalization of the Russell 1000 Index. As of the latest reconstitution, the average market capitalization was approximately $4.0 billion; the median market capitalization was approximately $2.9 billion. The largest company in the index had an approximate market capitalization of $12 billion.
Russell Midcap Growth: Market-weighted total return index that measures the performance of companies within the Russell Midcap Index having higher price-to-book ratios and higher forecasted growth values. The Russell Midcap Index includes firms 201 through 1000, based on market capitalization, from the Russell 3000 Index. The Russell 3000 Index represents 98% of the of the investable U.S. equity market.
Russell Midcap Value: Market-weighted total return index that measures the performance of companies within the Russell Midcap Index having lower price-to-book ratios and lower forecasted growth values. The Russell Midcap Index includes firms 201 through 1000, based on market capitalization, from the Russell 3000 Index. The Russell 3000 Index represents 98% of the of the investable U.S. equity market.
P/E Relative to Rest of World
TOPIX: This free-floated-adjusted index tracks all domestic companies of the exchange’s First Section.
US Fixed Income Valuation
ICE BofAML Option Volatility Estimate Index (MOVE): A yield curve-weighted index of the normalized implied volatility on one-month treasury option.
An investment cannot be made directly in a market index.